Note: This project was conducted during my second year of preparatory cycle at IPSA, as part of a large team-based initiative to build a full glider simulator from scratch. I led the data analysis team (“Pôle Analyse de Données”) in the second year. Our mission was to extract, analyze, and visualize flight data from real glider flights using Python. The project involved the development of an interface and multiple analysis tools, all available in the provided code files.
Abstract
This project focuses on the development of a Python-based analysis and visualization tool for glider flight data extracted from IGC files. The objective was to provide pilots and engineers with visual insights into flight performance and aerological conditions. The software parses, analyzes, and displays key metrics such as altitude variations, speeds, thermals, and terrain safety, with the help of visualization libraries like Matplotlib and Folium, and an interactive interface built using Tkinter.
1. Project Context and Objectives
This tool was developed within the scope of a larger group project aiming to simulate glider flight mechanics from scratch — including the physical nacelle, the embedded code, and the data post-processing.
Our team, composed of 8 members in the “Pôle C: Analyse de Données”, was responsible for building a complete data analysis suite. In my second year, I was appointed as team leader and contributed directly to both the backend and frontend aspects of the tool.
Key objectives:
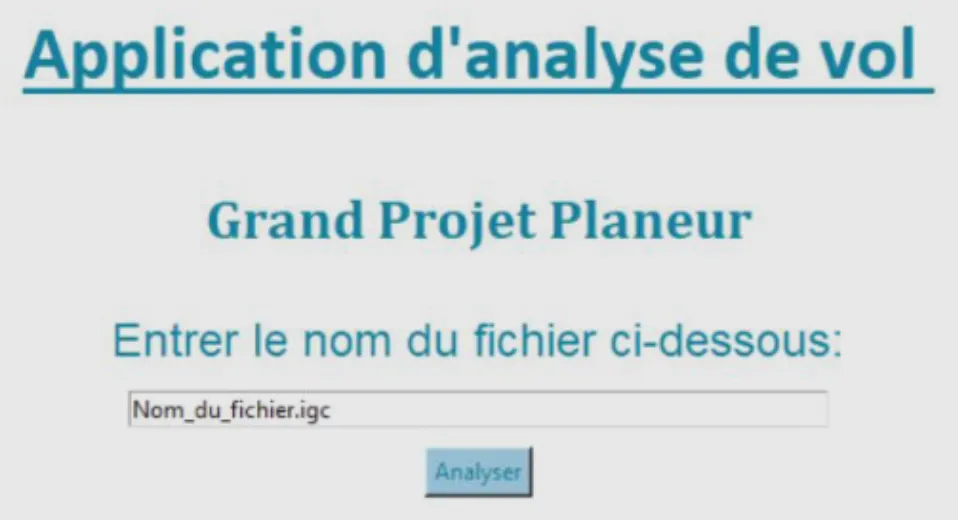
- Create a GUI for simple access to all analyses
- Enable automated extraction of relevant flight parameters
- Develop an interactive mapping system of glider trajectories
- Offer pilots concrete feedback on performance and risks
2. Architecture Overview
The project is divided into two main scripts:
Extraction_fonctions.py: core backend functions for IGC data parsing, trajectory reconstruction, thermal detection, MacCready analysis, etc.interface graphique GP.py: a Tkinter-based GUI for launching analyses and visualizations.
Additional resources (e.g., maps, background images) are integrated at runtime.
3. Key Functionalities
3.1 IGC File Parsing
The tool begins by parsing .igc files containing flight logs. These files include timestamped latitude, longitude, altitude, and speed information.
Steps:
- Open and decode IGC format
- Filter B-records (flight points)
- Extract geographic and kinematic data
✅ All this logic is handled within the function parser_igc.
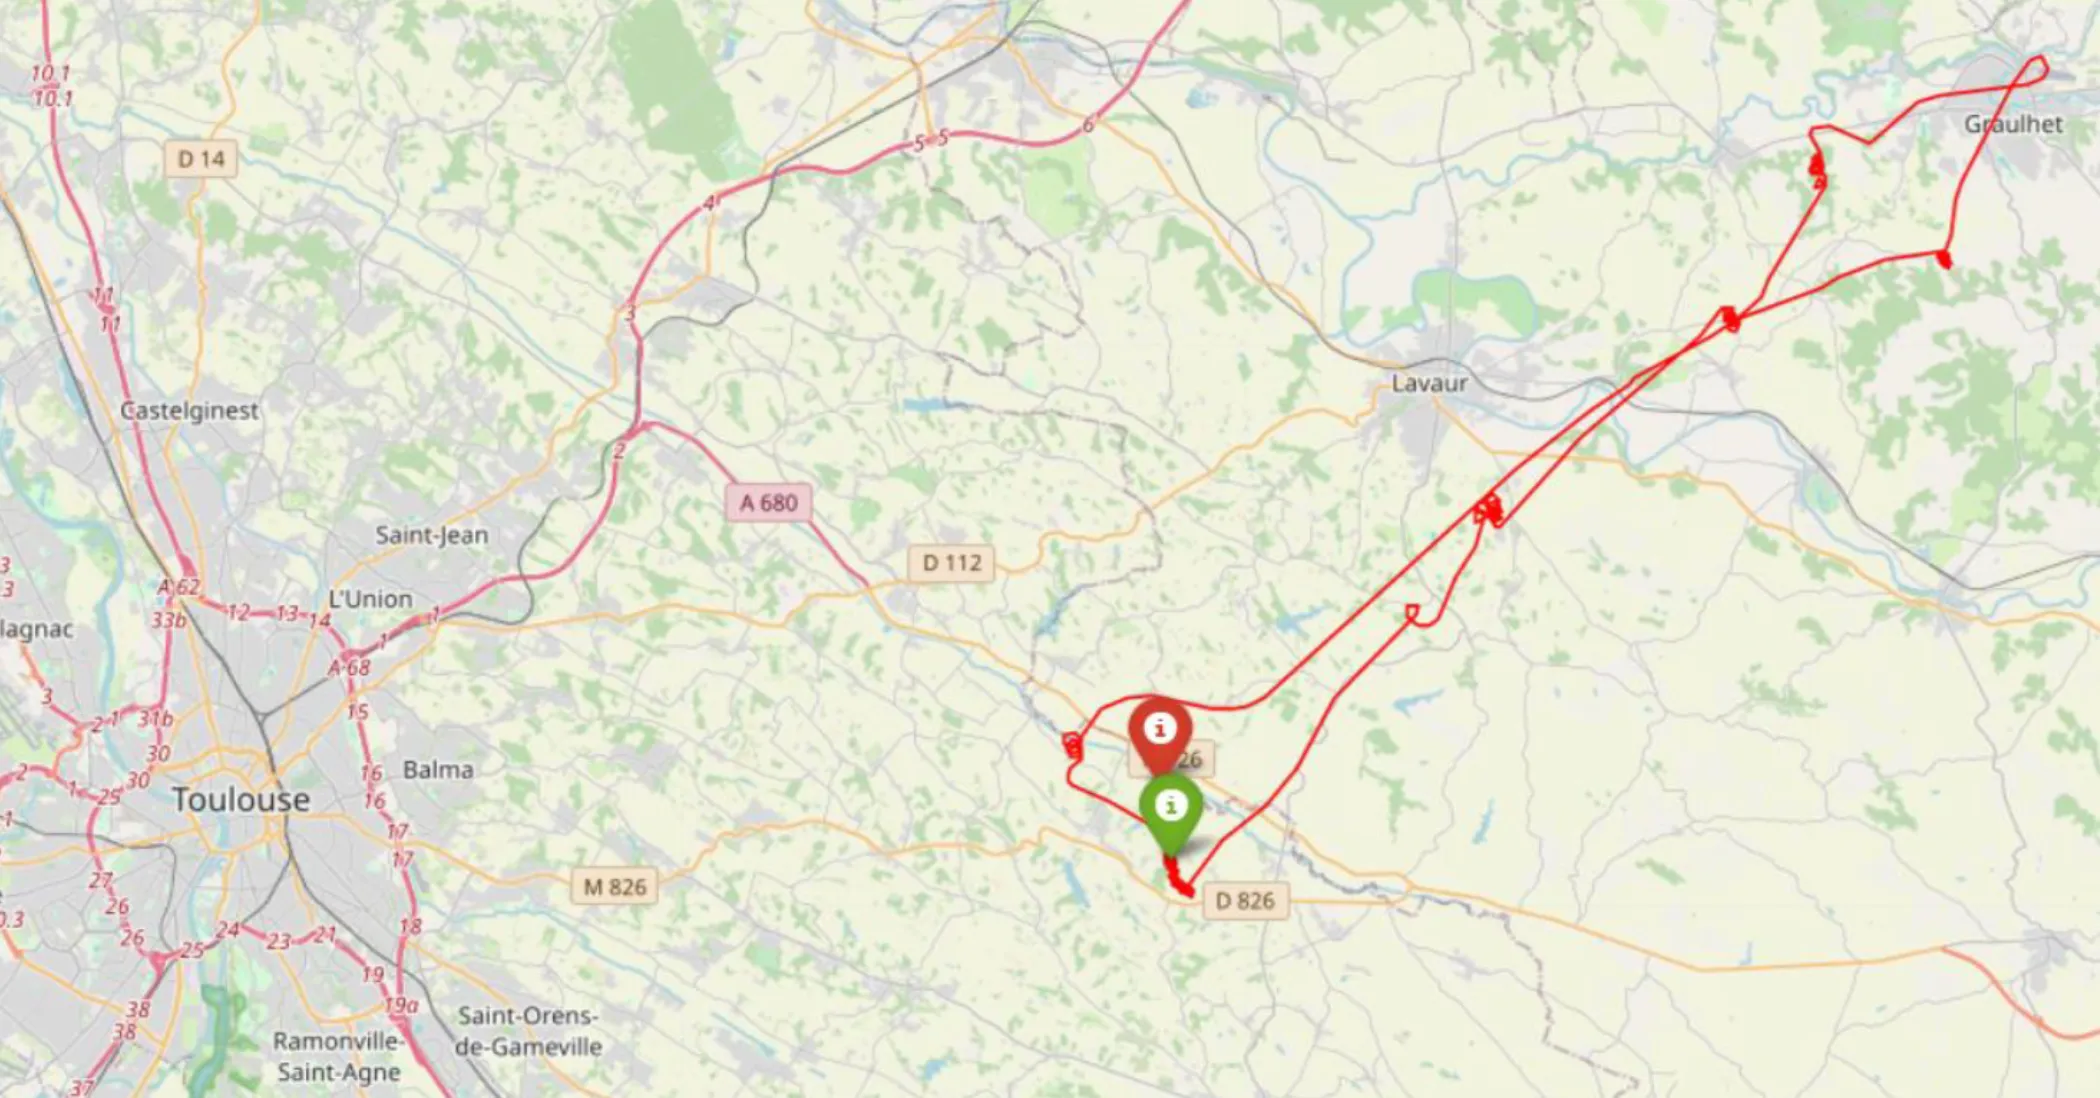
3.2 Trajectory Visualization
Using Folium, a flight path is rendered as an interactive map with:
- Markers for takeoff and landing
- Path tracing on a 2D map
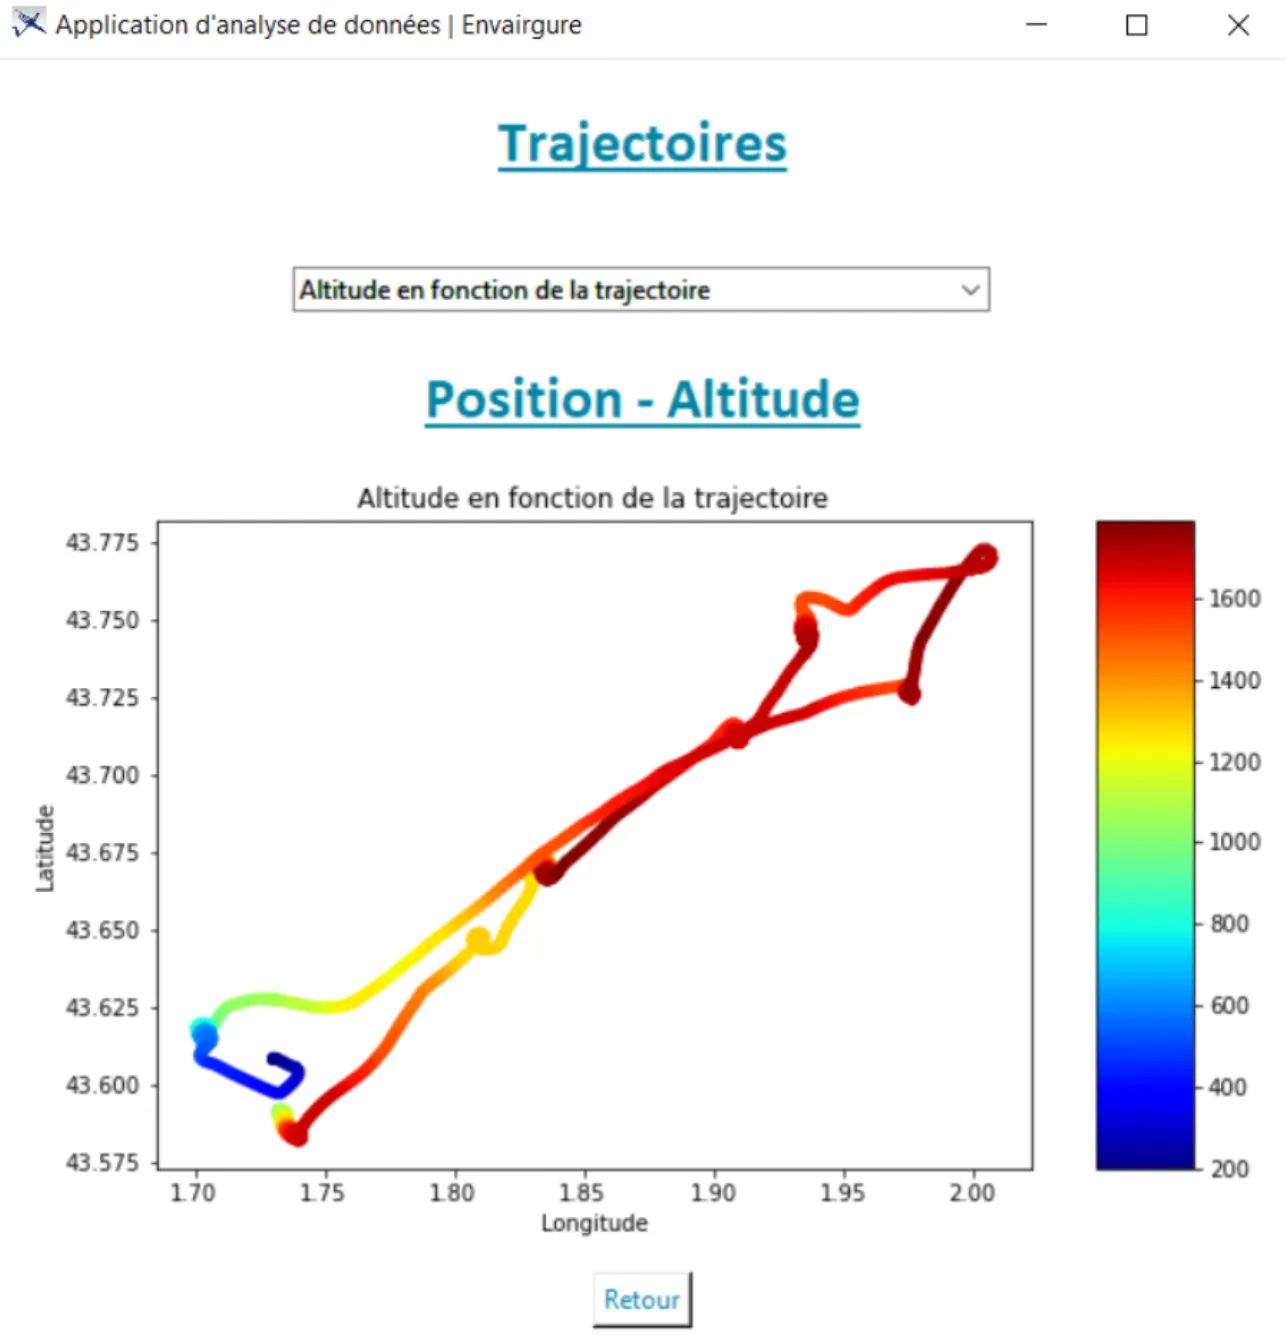
3.3 Altitude and Speed Analysis
We compute and display:
- Altitude vs time graphs
- Speed profiles with phase changes
- Points of significant altitude variation (thermals, descents)
These are generated using Matplotlib and support zooming and export.
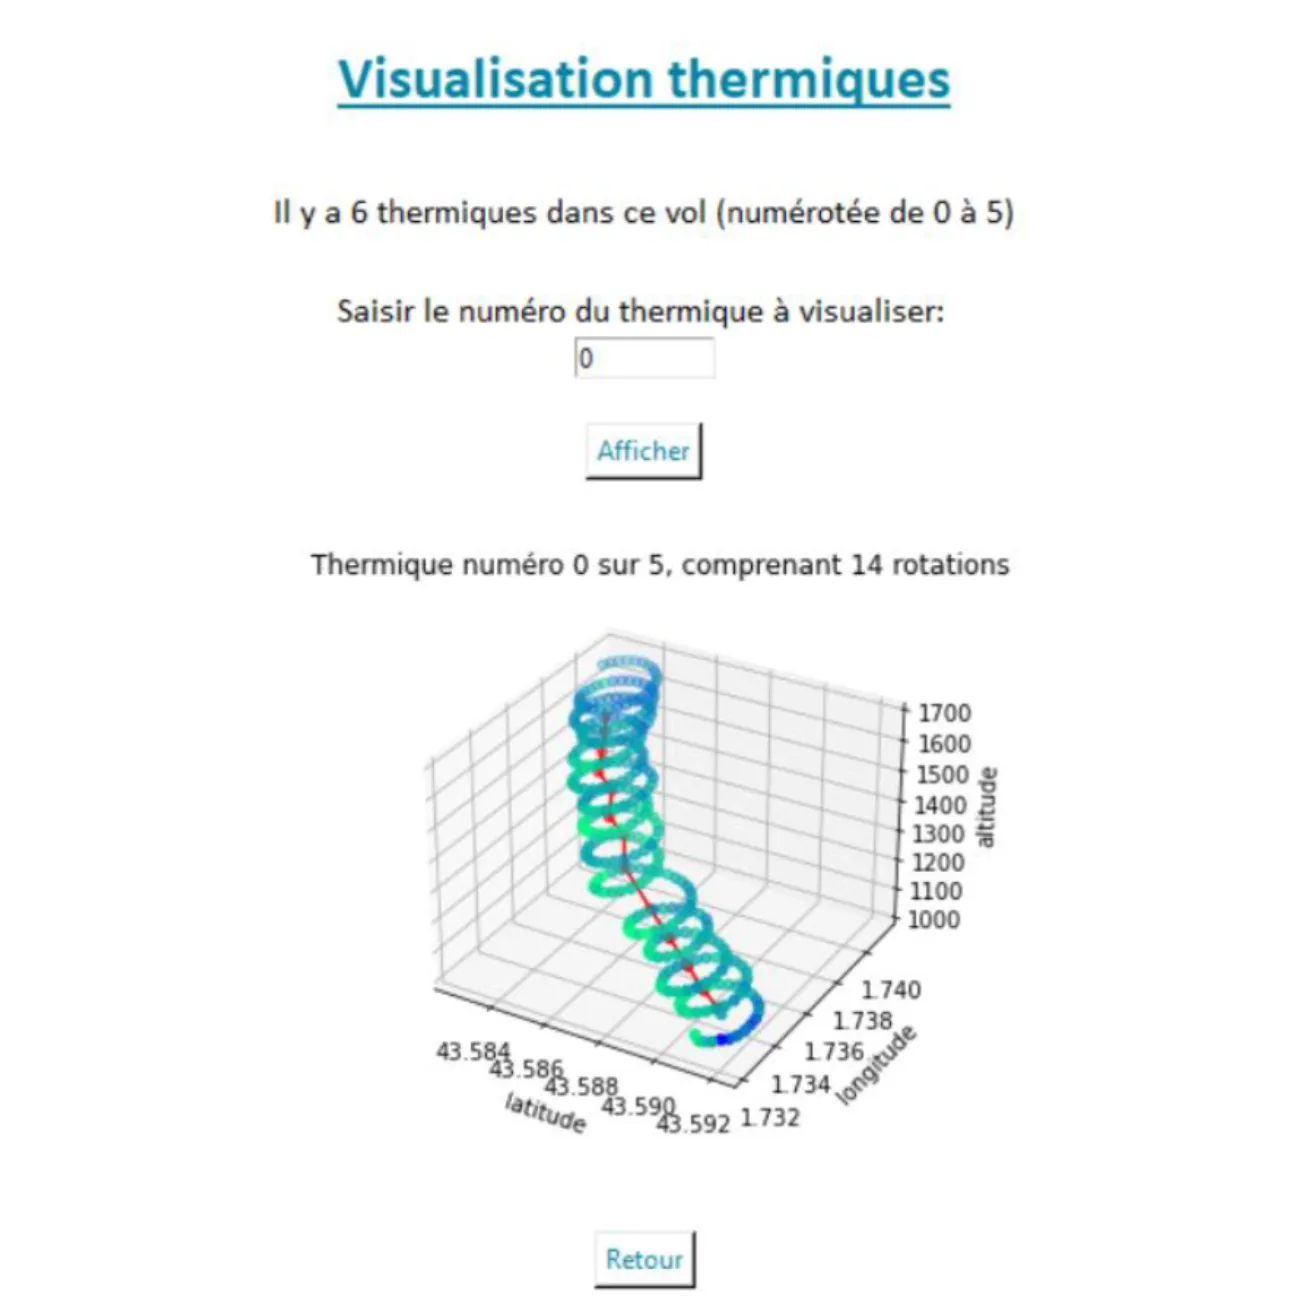
3.4 Thermal Detection
By analyzing segments of positive vertical speed and circular trajectories, we can identify and mark thermals.
Implemented logic:
- Rolling window on climb rate
- Angle of trajectory curvature
- Grouping points into thermal zones
🚀 Output: Zoom in on the pilot’s trajectory taken during the thermal.
3.5 MacCready Analysis
We compare pilot performance to the optimal MacCready theory:
- Computation of expected glide ratio based on altitude/speed
- Absolute deviation from optimal path shown as a time series
- Visual feedback for training or performance review
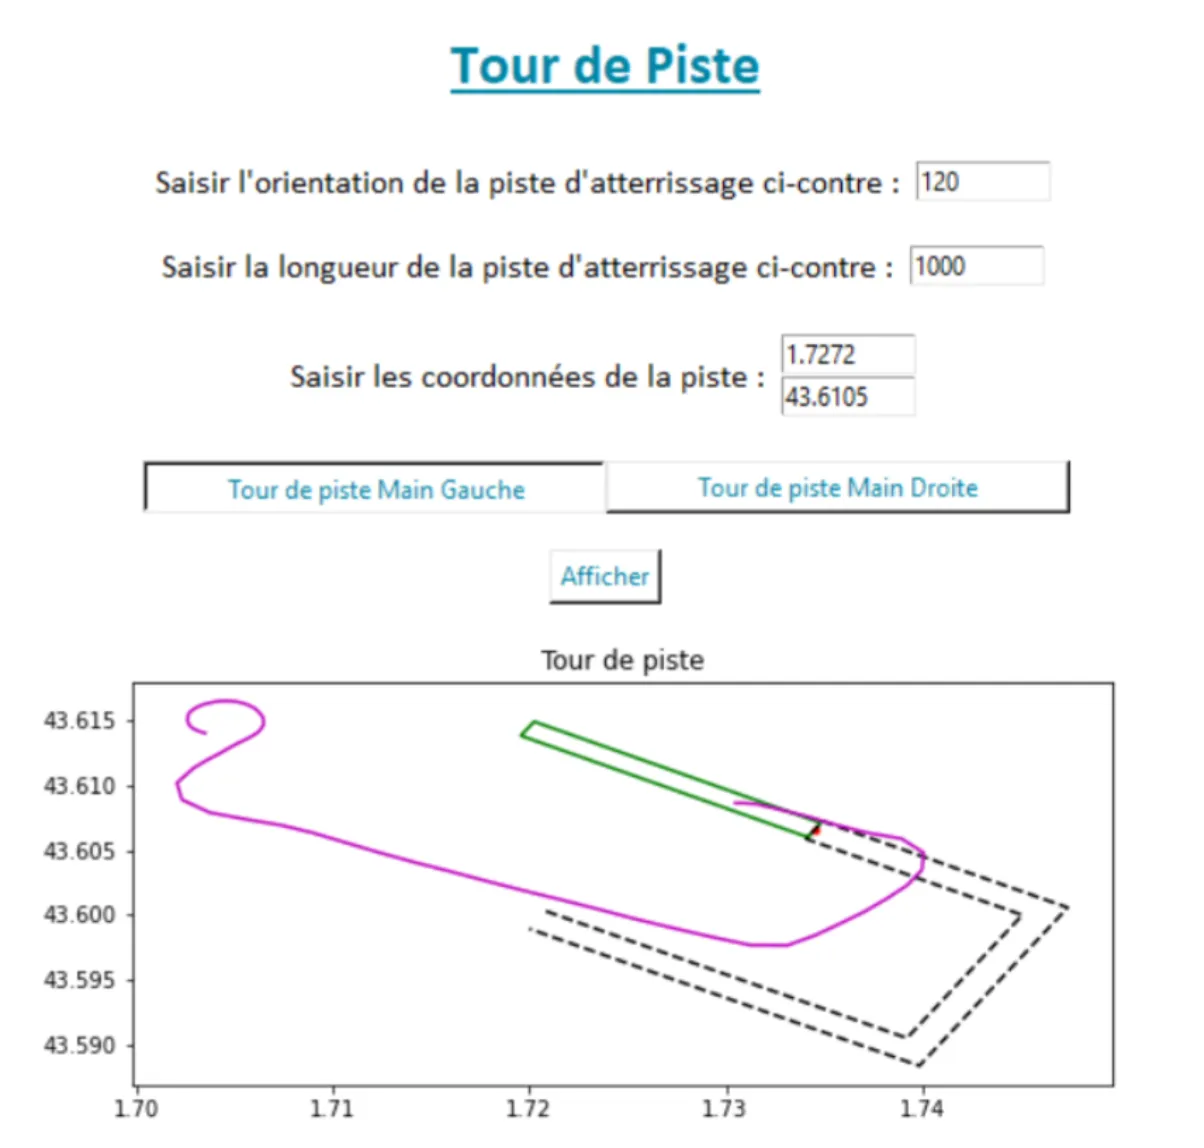
3.6 Final Approach and Landing Pattern
A custom module allows visualization of the last portion of flight:
- Detection of downwind/base/final legs
- Visualization of glide ratio vs terrain from current position
- Warnings when glide is insufficient to reach airfield safely
This safety module is essential for simulating realistic final approach planning.
4. User Interface
The GUI developed with Tkinter provides:
- File selection for IGC input
- Dropdowns for choosing specific analysis types
- Buttons to launch graph/map generation
- Live logging of operations
5. Challenges and Learnings
- Parsing non-standard IGC formats and ensuring compatibility
- Synchronizing time-based analyses across speed, altitude, and position
- Integrating multiple libraries (Folium, Matplotlib, Tkinter) in a cohesive app
- Designing useful features with real pilot feedback in mind
This project greatly deepened my understanding of Python for scientific analysis, flight dynamics, and interface programming.
6. Conclusion
The Glider Flight Data Analysis Tool is a versatile and educational Python-based suite that turns raw IGC logs into actionable insights. It highlights:
- Real-time flight mapping
- Performance diagnostics
- Flight safety visualization
- Interactive graphical exploration
It was a cornerstone in our glider simulation project, and a rewarding first experience leading a data engineering subteam.
Appendix
- 📁 Full implementation: see
Extraction_fonctions.pyandinterface graphique GP.py - 📄 Associated presentation:
Diapo_Soutenance_Pole_ADD.pdf - 🔧 Built using: Python 3.8+, Tkinter, Matplotlib, Folium, OS, datetime, math, …